Generate Excel from SQL Script
There are two ways to generate Excel from SQL queries:
-
Command Line Interface
-
Python API
Command Line Interface
SQL2Excel provides a CLI tool for generating Excel reports directly from annotated SQL scripts without writing any Python code.
sql2excel <sql_file> \
    --dialect <dialect> \
    --host <host> \
    --port <port> \
    --user <user> \
    --dbname <db> \
    --output <out_file>
Required arguments:
| Argument | Description |
|---|---|
sql_file |
Path to the .sql file to execute |
--dialect |
Database dialect (e.g. postgresql, mysql+pymysql) |
--port |
Database port |
--host |
Database host |
--user |
Database username |
--password |
Database password |
--dbname |
Database name |
--output |
Path to the output .xlsx file |
Environment variables: Any argument can also be set via environment variables: DB_DIALECT, DB_HOST, DB_PORT, DB_USER, DB_PASSWORD, DB_NAME. CLI flags take precedence over environment variables.
Example:
sql2excel queries.sql \
    --dialect postgresql \
    --host localhost \
    --port 5432 \
    --user admin \
    --dbname my_db \
    --output report.xlsx
Warning
While you can, you should not type your password in the terminal directly. The password will be visible in your history. Instead, you can store your database credentials in a specific file in your home directory ~/.dbpass or use environment variables. Currently, the ~/.dbpass works for Linux and Mac only.
Tip
On Linux and Mac, the CLI can read passwords from ~/.dbpass. This file must have 0600 permissions and be owned by the current user. Each line follows the format dialect:host:port:user:password:dbname where * can be used as a wildcard. The most specific match wins. If a password is found in ~/.dbpass, the --password flag is ignored.
It is important to note that if the permission of ~/.dbpass are not set correctly or if the current user is not the owner of ~/.dbpass, SQL2Excel ignores the file and the password will not be read.
PostgreSQL users should be familiar with ~/.dbpass as it is similar to ~/.pgpass for storing PostgreSQL credentials.
Note
The SQL file must be annotated with special directives (e.g. -- chart, -- sheetname) to instruct SQL2Excel how to export the query result. For more details on the directives, see Annotate SQL Script section.
Python API
To generate a report from SQL script using the Python API, you need to do two steps:
- Annotate the SQL script by including directives (special comments).
- Create a
Reportobject and call itsgeneratemethod.
This example below shows you how this can be done.
from sql2excel.parser import parse_sql_file
from sql2excel.report import Report

# NOTE db_url is the SQLAlchemy URI in the form
db_url = "dialect+driver://username:password@host:port/database"


# Provide the path to the SQL script
query_configs = parse_sql_file(
    "path/to/sql/my_script.sql"
)

# Create a report object
report = Report(db_url=db_url)

# Generate the Excel report and save the results to a file
report.generate(
    query_configs, fname="path/to/save/excel/my_report.xlsx"
)
NOTE: You need to escape your password if it contains a special character used in the DB URL by
SQLAlchemy such as : or @. See Database URL
Annotate SQL Script
Once you write your SQL script, you need to add special comments (called directives) to instruct SQL2Excel how to export the query result.
In general, there are two directives:
-- chartdirective for exporting data and optionally generating charts.-- execdirective for executing SQL queries without export their results.
Comments and SQL code that is not annotated are ignored by SQL2Excel.
Writing Data
To write the result of a SQL query into an excel, add -- chart directive as a comment anywhere above the query.
-- chart
SELECT
    name,
    MIN(rental_rate),
    AVG(rental_rate),
    MAX(rental_rate)
FROM
    category c
    INNER JOIN film_category fc ON c.category_id = fc.category_id
    INNER JOIN film f ON fc.film_id = f.film_id
GROUP BY
    1
ORDER BY
    3 DESC;
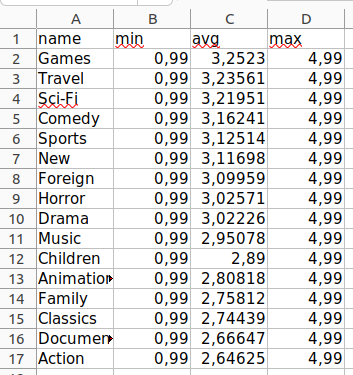
The result in the Excel workbook should look like:
Writing Data and Generating Charts
To export query result and generate a chart from the exported data, specify the chart type by placing a directive anywhere above the SQL code as follows:
-
-- chart=chart_typeor -
-- chart:chart_type
The chart_type is any of the supported charts listed below. For example, this directive -- chart=line will generate a line chart from the query result. Currently, the supported charts are listed below:
| Chart | Directive |
|---|---|
| area | -- chart=area |
| bar | -- chart=bar |
| barline | -- chart=barline |
| bubble | -- chart=bubble |
| chart | -- chart=chart |
| line | -- chart=line |
| pie | -- chart=pie |
| radar | -- chart=radar |
| scatter | -- chart=scatter |
| stackedbar | -- chart=stackedbar |
You can also use : instead of = (e.g., -- chart: line).
For example, the result set of the query below will be exported to Excel and a bar chart will be generated from the result set.
-- chart=bar
SELECT
    name AS category,
    count(DISTINCT rental_id) AS rental_count
FROM
    category c
    INNER JOIN film_category fc ON c.category_id = fc.category_id
    INNER JOIN film f ON fc.film_id = f.film_id
    INNER JOIN inventory i ON f.film_id = i.film_id
    INNER JOIN rental r ON i.inventory_id = r.rental_id
GROUP BY
    1
ORDER BY
    2 DESC;
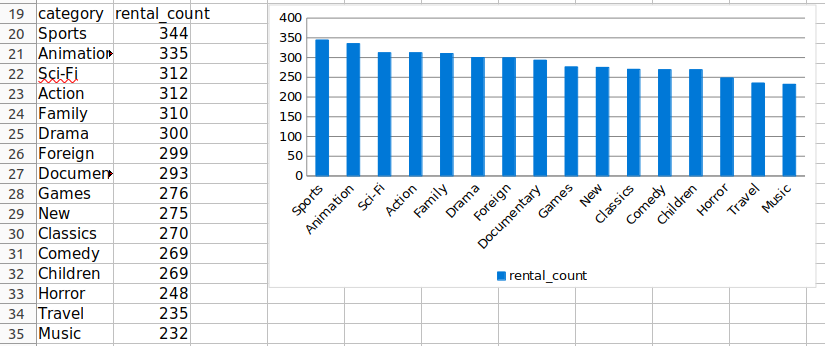
Note
By default, all columns returned by a query are written into Excel, and all columns are used to generate the chart. The first column must be the category (x-axis). If your query does not meet this requirement, rearrange the columns as such. It is possible to select specific column to generate the chart. See Generating Charts from Specific Columns section.
Chart Customization
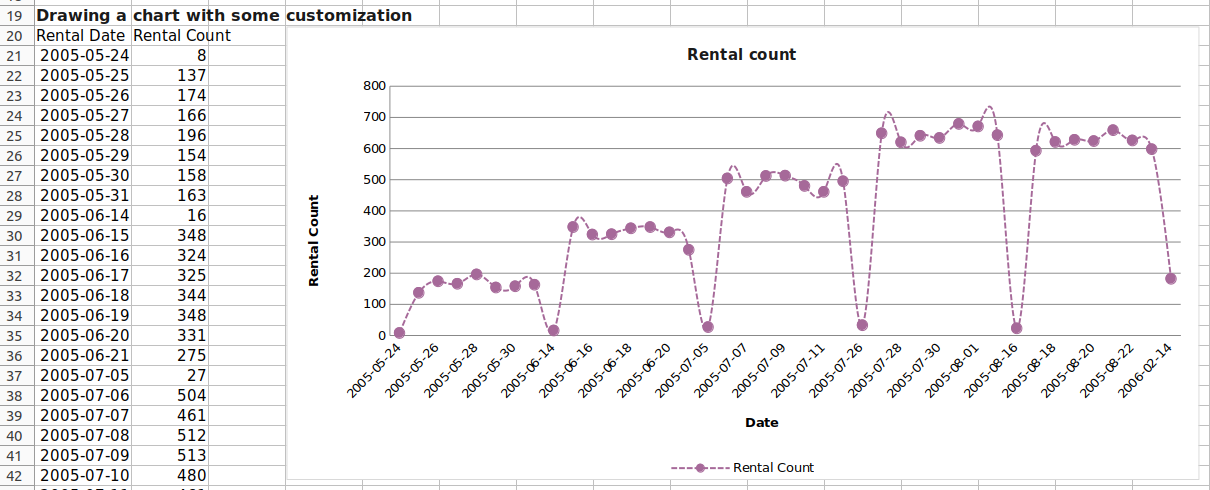
SQL2Excel offers options for basic customization. Customization options can be provided as directives above the SQL query in one line or spread over multiple lines. An example is shown below
-- chart=line, width=25, height=12
-- section_heading=Drawing a chart with some customization, title=Rental count
-- xlabel=Date, ylabel=Rental Count
-- line_width=1.5, line_style=sysDash, marker_symbol=circle
-- marker_size=8, line_color=A66999
SELECT
    rental_date :: date AS "Rental Date",
    COUNT(DISTINCT rental_id) AS "Rental Count"
FROM
    rental
GROUP BY
    1
ORDER BY
    1;
For a full list Excel options, see Featured Options.
Pivoting Result Set
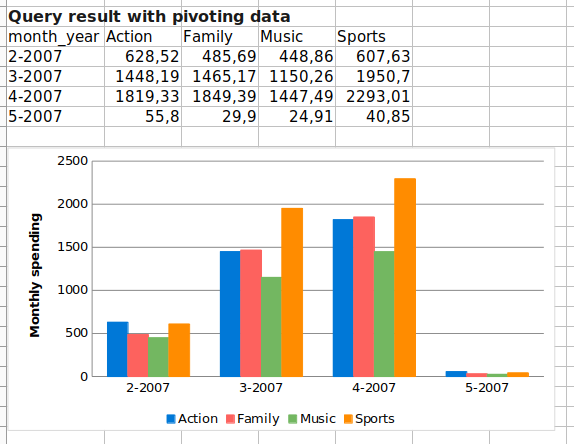
Pivoting data to convert it from long format to wide format typically requires writing cumbersome SQL code or using external extensions in some databases. SQL2Excel simplifies pivotting result set. You need to decorate your query with three parameters:
index: The column to use as the index in the pivoted table. Each value in the index column will have one row in the pivoted table.columns: The values in this column will be used as the columns in the pivoted table.values: The column to use as the values in the pivoted table.
-- chart: bar, section_heading=Query result with pivoting data
-- index=month_year, columns=category_name, values=total_payment
SELECT
    extract(
        'month'
        FROM
            p.payment_date
    ) || '-' || extract(
        'year'
        FROM
            p.payment_date
    ) AS month_year,
    c.name AS category_name,
    SUM(p.amount) AS total_payment
FROM
    payment p
    JOIN rental r ON p.rental_id = r.rental_id
    JOIN inventory i ON r.inventory_id = i.inventory_id
    JOIN film f ON i.film_id = f.film_id
    JOIN film_category fc ON f.film_id = fc.film_id
    JOIN category c ON fc.category_id = c.category_id
WHERE
    c.name IN ('Family', 'Action', 'Sports', 'Music')
GROUP BY
    1,
    2
ORDER BY
    1,
    2;
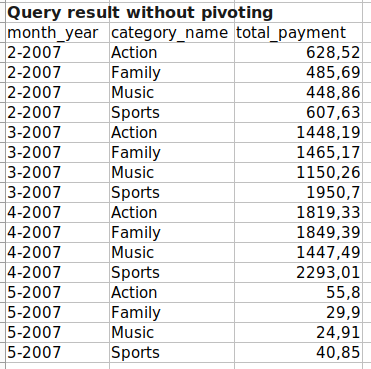
The result without pivoting is shown below:
The result with pivoting is shown below:
Generating Charts from Specific Columns
By default, all columns returned by a query are written into Excel, and all columns are used to generate the chart. The first column must be the category (x-axis). If your query does not meet this requirement, rearrange the columns as such. It is possible to write all columns into an Excel sheet but use specific columns to generate the chart. There are two ways to do this:
- Use
data_column_startanddata_column_endif the columns to be used in the chart are consecutive - Use
data_columnsif the columns to be used in the chart are not consecutive.
Using data_column_start and data_column_end
data_column_start and data_column_end allow you to select specific continguous columns in the result set for the chart.
data_column_start: the starting column index for the chart data.data_column_end: the ending column index for the chart data.
Tip
Indexes start from 1 (first column or first row depending on the context).
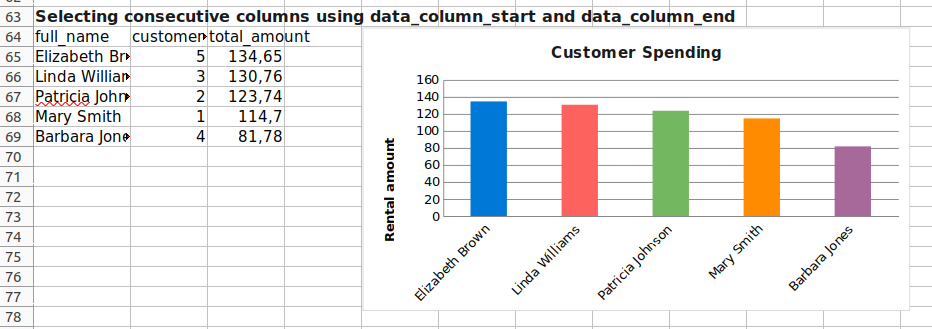
For example, in the query below, all three columns will be written. However, the bar chart will only
be generated from the first column (x-axis) and the third column (amount) because of data_column_start:3.
In this case, you could have dropped data_column_end:3 because we only drawing one column.
-- chart:bar, data_column_start:3, data_column_end:3
-- section_heading: Selecting consecutive columns using data_column_start and data_column_end
--title: Customer Spending, ylabel: Rental amount, vary_color: True
SELECT
    c.first_name || ' ' || c.last_name AS full_name,
    c.customer_id,
    SUM(p.amount) AS total_amount
FROM
    customer c
    JOIN payment p ON c.customer_id = p.customer_id
WHERE
    c.customer_id IN (1, 2, 3, 4, 5)
GROUP BY
    1,
    2
ORDER BY
    3 DESC;
Using data_columns
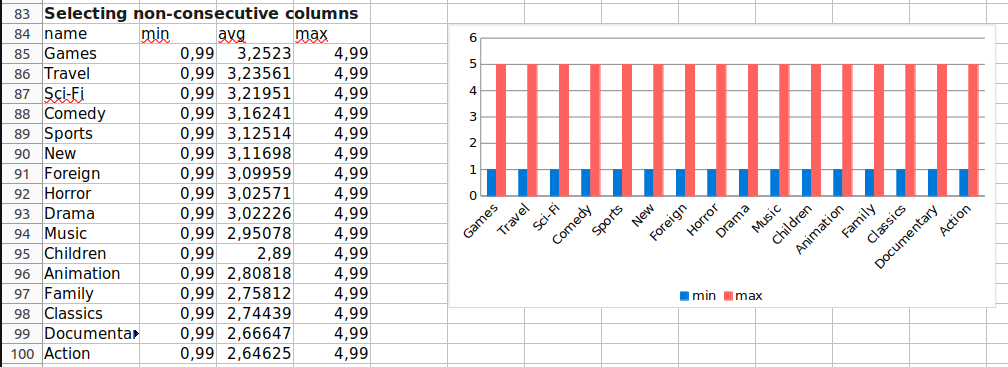
You can be more explicit by listing specific columns to include in the chart using data_columns. This is useful when the columns to be used in the chart are not consecutive. data_columns is a comma-separated list of column indices to use for the chart.
-- chart:bar
-- Use the 2nd and 4th columns in the bar chart
-- data_columns=[2, 4], section_heading=Selecting non-consecutive columns
SELECT
    name,
    min(rental_rate),
    avg(rental_rate),
    max(rental_rate)
FROM
    category c
    INNER JOIN film_category fc ON c.category_id = fc.category_id
    INNER JOIN film f ON fc.film_id = f.film_id
GROUP BY
    1
ORDER BY
    3 DESC;
Organizing Query Results into Separate Sheets
By default, all query results are exported into the same sheet within the Excel workbook. However, in many cases, you may need to separate results into different sheets based on logical groupings.
SQL2Excel allows you to organize related queries into separate sheets using the -- sheetname directive. Once this directive is encountered, all subsequent query results are written to the specified sheet until another -- sheetname directive is encountered.
If the sheet name already exists, SQL2Excel appends results to that sheet instead of creating a new one. For example, the queries below will be written into two sheets: "sales" and "cost". The first and third query will be written into "sales" worksheet and the second query will be written to the "cost" worksheet
-- sheetname=sales
-- chart
select *
from sales_table
where product='Laptop';

-- sheetname=cost
-- chart
select *
from cost_table;

-- sheetname=sales
-- chart
select *
from sales_table
where product='Phone';
Tip
The recommended convention is to place -- sheetname directive in its own line.
Parameterized SQL Scripts
SQL2Excel supports two types of parameter directives for SQL scripts: -- sheet_param and -- query_param.
Sheet Paramters
-- sheet_param defines a parameter that repeats the entire script for each value, creating a separate worksheet for each parameter value. It is sheet-specific (defined once anywhere in the script) and limited to one parameter name per SQL script. Each query in the script is executed once per parameter value, and the results are output to separate worksheets named after each value.
Imagine you write a SQL script for country-specific analysis and want to apply that same script across multiple countries. You can use -- sheet_param to pass a list of countries, and SQL2Excel will run the entire script once for each country, outputting the results into a separate Excel sheet per country.
Syntax:
-- sheet_param <parameter_name> = <value1> | <value2> | <value3>
parameter_name: The name of the parameter (e.g.country_name).- Pipe-separated values: Each value triggers an execution of the entire script.
Rules:
-
Only one
sheet_paramname is allowed per SQL script. If multiplesheet_paramdirectives with different names are used, an error is raised. -
Wherever
:<parameter_name>appears in a query, it is replaced by each parameter value in turn (note the:). -
If
-- section_headingincludes the parameter name (with or without:), it is also replaced with the actual value.
You must be consistent when referring to your parameter in SQL queries and prefix them with :. For example, if you choose to name your parameter my_awesome_param then it must appear as :my_awesome_param in SQL queries.
The example defines a sheet parameter category_name with three values "Sports", "Family", and "Action". Hence, the final Excel workbook will contain three sheets where each sheet will contain the result of the two queries. The sheet titles (sheet names) will be "Sports", "Family", and "Action".
-- sheet_param category_name = Sports | Family | Action
-- chart
-- section_heading=category_name
SELECT
    *
FROM
    category
WHERE name = :category_name;


-- chart
-- section_heading=Shortest 10 films in category_name
SELECT
    f.film_id, f.title, c.name, f.length
FROM film f
    JOIN film_category fc ON f.film_id = fc.film_id
    JOIN category c ON fc.category_id = c.category_id
WHERE name = :category_name
ORDER BY f.length
LIMIT 10;
Tip
Note the : is necessary inside SQL query (as in :category_name) but not necessary in section_heading.
Query Parameters
query_param defines parameters scoped strictly to an individual query within a script. Unlike sheet_param, it does not create separate worksheets — instead, it generates multiple QueryConfig objects for the same query, each with a different combination of parameter values. This means that the query will be executed once for each combination of all query parameters.
Syntax:
-- query_param <parameter_name> = <value1> | <value2> | <value3>
parameter_name: The name of the parameter.- Pipe-separated values: Each value is combined with other
query_paramvalues via cartesian product.
Rules:
-
Multiple
query_paramdirectives are allowed per query. -
When multiple
query_paramdirectives are present, all combinations are generated (cartesian product). -
Wherever
:<parameter_name>appears in the query, it is replaced by the corresponding parameter value.
The example below combines sheet_param with query_param. This mean for each film category ("Sport", "Family", "Action"), the query below will be executed three times for each rating ("PG", "PG-13", "R").
-- sheet_param category_name = Sports | Family | Action
-- chart=bar
-- section_heading=Top Rented Films in category_name for rating rating_p
-- query_param rating_p=PG | PG-13 | R
SELECT
    f.title,
    COUNT(DISTINCT r.rental_id) AS total_rentals
FROM film f
    JOIN film_category fc ON f.film_id = fc.film_id
    JOIN category c ON fc.category_id = c.category_id
    JOIN inventory i ON f.film_id = i.film_id
    JOIN rental r ON i.inventory_id = r.inventory_id
    JOIN payment p ON r.rental_id = p.rental_id
WHERE name = :category_name AND f.rating = :rating_p
GROUP BY f.film_id, f.title
ORDER BY total_rentals DESC
LIMIT 10;
Tip
It is a good practice to append _p to your parameter name (e.g., rating_p) if it clashes with database column with the same name.
Warning
If section_heading directive includes a word exactly the same as the parameter name (e.g., 'rating') it will not be rendered correctly in Excel. This is a second reason why you should append _p to your parameter name.
Therefore:
-
Recommended:
WHERE rating = :rating_p -
Discouraged:
WHERE rating = :rating